What are Outliers?
Outliers, those elusive data points significantly deviating from the norm, hold the power to skew statistical analyses and modelling outcomes. In this extensive guide, we embark on a comprehensive exploration of the intricacies involved in detecting and effectively removing outliers, leveraging the versatile programming language, Python.
Understanding Outliers:
Outliers, stemming from various sources like measurement errors and data entry anomalies, pose a substantial threat to data accuracy. These anomalies can distort the results of statistical analyses, leading to misleading conclusions and impacting the reliability of models. Recognizing and addressing outliers is critical for upholding the integrity of statistical analyses, ensuring that the insights derived are robust and reflective of the true underlying patterns in the data.
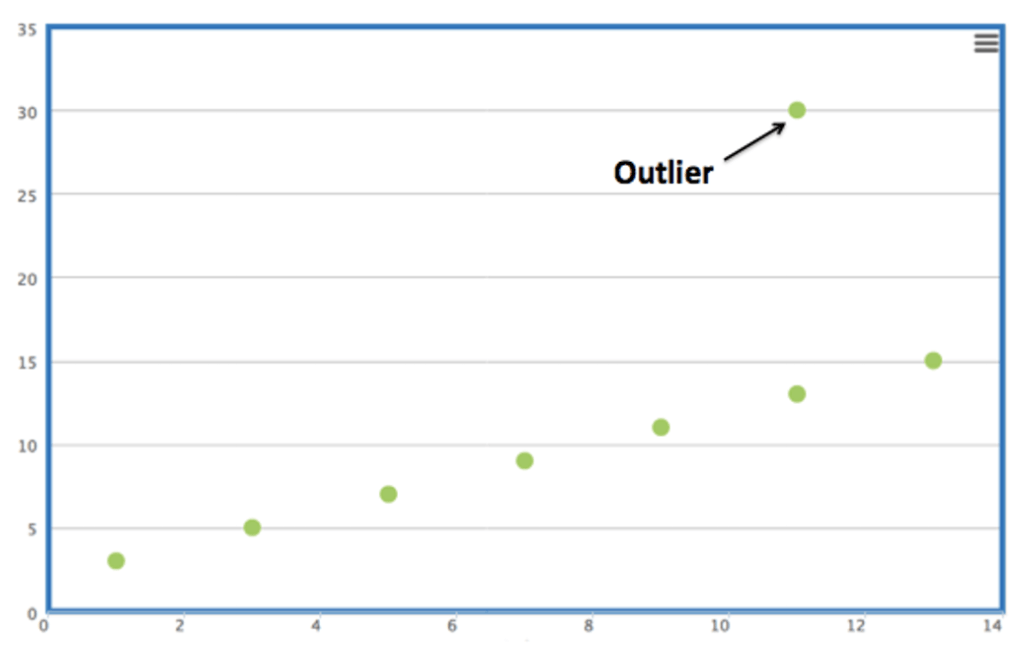
Illustrating Outliers:
The visual representation of outliers serves as a powerful tool in understanding their impact on a dataset. This visual representation offers a clear depiction of their deviations from the overall data distribution. Such a visual aid not only aids in identifying outliers but also in conveying the magnitude of their influence, emphasizing the need for effective outlier management strategies.
Root Causes of Outliers:
Distinguishing between outliers resulting from errors and those representing genuine deviations is pivotal for effective outlier management. Errors, such as data entry blunders leading to inflated student scores, can introduce outliers that do not reflect the true characteristics of the underlying phenomenon. On the other hand, outliers stemming from genuine deviations, such as the elevated income of a tech company CEO, might carry valuable information rather than being mere errors. Understanding the root causes allows for a targeted approach in handling outliers, ensuring that the chosen strategy aligns with the nature of the data.
Approaches to Outlier Treatment:
The strategy for handling outliers is context-dependent and requires a thoughtful consideration of the specific characteristics of the dataset. While certain situations call for the outright removal of outliers or the application of data cleaning techniques, there are instances where genuine outliers should be retained. Retaining genuine outliers becomes crucial when these data points carry valuable information about the phenomenon under study. In such cases, employing robust analytical methods that are not strongly influenced by outliers becomes imperative to prevent undue bias in subsequent analyses.
Methods for Outlier Detection:
1. Z-Score Method:
- Definition: The Z-Score method quantifies how many standard deviations a data point is away from the mean.
- Procedure: Calculate the Z-Score for each data point by subtracting the mean and dividing by the standard deviation. Data points with a Z-Score exceeding a predefined threshold, typically set at 2 or 3, are identified as outliers.
- Elaboration: The Z-Score method provides a standardized measure of how far each data point is from the mean, allowing for a comparison across different datasets. The threshold value determines the sensitivity of the method; a lower threshold captures more potential outliers, while a higher threshold focuses on extreme deviations.
2. IQR (Interquartile Range) Method:
- Definition: The IQR method centers on the range between the 75th and 25th percentiles of the data.
- Procedure: Identify outliers by flagging data points falling below Q1 – 1.5 * IQR or above Q3 + 1.5 * IQR.
- Elaboration: The IQR method is robust against skewed data and outliers themselves. It defines a range within which the majority of the data points lie, making it less sensitive to extreme values. The 1.5 multiplier is a commonly used threshold, and adjustments can be made based on the desired level of sensitivity.
3. Visualization:
- Definition: Visualization involves plotting the data on a box plot or scatter plot to facilitate the identification of outliers.
- Procedure: Scan for data points conspicuously distant from the main cluster, signifying potential outliers.
- Elaboration: Visualization is a powerful exploratory tool, allowing analysts to intuitively identify patterns and anomalies in the data. Outliers often stand out visually, appearing as points that deviate significantly from the general trend. This method is especially valuable when dealing with multidimensional datasets where traditional statistical methods may fall short.
4. Isolation Forest:
- Definition: The Isolation Forest algorithm is an outlier detection technique that constructs isolation trees to efficiently identify anomalies within a dataset.
- Procedure: The algorithm works by creating random isolation trees. Each tree isolates a data point by randomly selecting features and splitting the dataset until the point is isolated. Outliers, requiring fewer splits for isolation, are identified more quickly.
- Elaboration: Isolation Forest is particularly effective for high-dimensional data and large datasets. It excels at isolating anomalies without relying on assumptions about the normal distribution of data. Its efficiency is derived from the idea that outliers are easier to isolate than normal data points.
Outlier Handling Strategies:
After the identification of outliers, diverse strategies come into play to mitigate their impact on subsequent analyses. These strategies are not one-size-fits-all and should be chosen based on the characteristics of the data and the goals of the analysis.
1. Exclusion:
- Procedure: Remove the identified outliers from the dataset.
- Elaboration: Exclusion is a straightforward approach, particularly when outliers are deemed as noise or errors. However, caution is required to ensure that the removal of outliers does not result in a loss of valuable information, especially when dealing with small datasets.
2. Data Transformations:
- Procedure: Apply data transformations, such as logarithmic or square root transformations, to mitigate the effect of outliers.
- Elaboration: Transformations can be effective in reducing the impact of outliers, especially when the dataset exhibits a skewed distribution. Logarithmic transformations, for instance, compress the scale of large values, making extreme values less influential. However, the choice of transformation should align with the characteristics of the data.
3. Imputation Techniques:
- Procedure: Replace outlier values with more reasonable estimates using imputation techniques, such as utilizing the median or mean of non-outlying data points.
- Elaboration: Imputation provides an alternative to exclusion, allowing for the retention of data points while mitigating the impact of outliers. The choice between median and mean imputation depends on the distribution of the data, with the median being more robust against extreme values.
4. Clustering:
- Procedure: Clustering involves grouping data points into clusters, providing an alternative strategy for handling outliers. Outliers, exhibiting distinct patterns, may form a separate cluster.
- Elaboration: Clustering allows for the identification and separation of outliers based on their unique characteristics. This approach is beneficial when outliers represent specific behaviours or events that are of interest. However, careful consideration of hyperparameter tuning and the assumptions of the clustering algorithm is essential for reliable results.
Python Implementation:
Transitioning to Python, this guide provides practical demonstrations of outlier detection and removal using both the Z-Score and IQR methods. Python, with its rich ecosystem of libraries, offers efficient tools for data analysis and visualization, making it a preferred choice for handling outliers. Code snippets and examples guide users through the step-by-step process, empowering them to apply these techniques to their own datasets.
Data Pre-processing Pipeline:
Recognizing the integral role of outlier management in data pre-processing, the guide extends beyond outlier detection, offering insights into a comprehensive data pre-processing pipeline in Python. Data pre-processing involves a series of steps to clean, transform, and prepare the data for analysis. This pipeline encompasses essential steps, ensuring a thorough and systematic approach to data preparation. Beyond outlier handling, topics such as missing data imputation, feature scaling, and encoding categorical variables are covered, providing a holistic view of the data preparation process.
Conclusion:
Outliers, with their potential to exert influence on analyses, necessitate meticulous consideration. This comprehensive guide, spanning over a thousand words, equips you with valuable insights into the nuanced process of detecting and handling outliers using Python. The exploration of methods, their elaboration, and practical Python implementation, combined with a broader understanding of data pre-processing, empower you to master the art of outlier detection and propel your data analyses to new heights. For further inquiries or discussions, feel free to engage in the comments section. Dive into the realm of outlier management, and unlock the full potential of your data analyses.

Leave a comment